<img height="1" width="1" style="display:none" src="https://www.facebook.com/tr?id=416052772573511&amp;ev=PageView&amp;noscript=1">

Live Graphics, Statistics and Sponsors for Grassroot Sports Broadcasts - The Scorebug

Image from iOS (8)The scoreboard on a live sports match – otherwise known as the scorebug – is obviously the most important live graphic in broadcast sports.

The scorebug or scoreboard.

The scoreboard on a live sports match – otherwise known as the scorebug – is obviously the most important live graphic in broadcast sports. Without it, viewers who have not been completely focused on the game will have no idea what the score is or how long is left to play. Combined, these two basic facts tell the viewer exactly how the game is poised, which is crucial for the viewing experience.

Consider this screengrab from a live streamed soccer match below that’s missing a scorebug. Is the first half just kicking off, or is this the second half? Has a goal just been scored? We have no idea where we are in the game or which team is winning, so as a fan, it’s very difficult to get any enjoyment from the game.

Football/soccer game without any graphics Football/soccer game without any graphics

Now compare that experience with the screengrab below. The scorebug immediately tells the viewer where we are in the game: Melbourne Victory are a goal down, but there’s still plenty of time to turn things around. It’s a powerful and essential graphic – and combined with the logo in the opposite corner, the viewer also knows what competition the game is being played in, or the broadcasting channel.
 
Football/soccer live stream with a scorebug and watermark, powered by LIGR.
 
To operate a scorebug, you need to perform three basic functions:
  • Enter the team names
  • Enter and update the scores
  • Start and stop the clock
Most live stream graphics software solutions have empty textboxes for the team names and buttons to control the score and time. Someone has to enter these before the game, and manually update them as the game progresses.

At LIGR, we take a sport specific approach. The platform knows how many points there are for a field goal or how long a quarter of basketball is, and the LIGR dashboard handles the team names and graphics for each team – including entering in their long, medium and short names.

The LIGR Scorebug Graphic is operated using our intuitive LiveScore app, which updates the scorebug based on in-game events. Instead of typing the names of the teams into the actual graphic pre-game, manually bumping up the score or hitting “start clock”, you can easily create a game in the LIGR platform by selecting two teams from your user dashboard that you have pre-configured. Then, you just open the LiveScore app and hit the sport-specific buttons that correspond to events that happen in the game. The Scorebug Graphic then updates automatically based on your inputs. We also log these events for every game, creating a database of exactly when each event occurred during the game. This creates a resource that allows you to take advantage of our in-game real time graphics that compare statistics to previous games or seasons. You can then give your viewers a more premium viewing experience.

For example, the start of almost every soccer match follows this series of events:
  • The players walk out onto the field
  • The referee tosses the coin
  • The winner chooses the direction they want to play and the players shake hands
  • Play is about to start
  • Kick off
In the LIGR LiveScore app, each one of these events has a dedicated button so the operator can simply follow along with the action and press each button as it happens. When “kick off” is pressed, the scorebug graphic starts the timer and, depending on your configured settings, the kick off graphic will animate and neatly transform into the scorebug in the corner of the screen – just as it does on broadcast TV. When a goal is scored, you hit the goal button for the scoring team, and the scorebug will automatically update in the live graphic. Our intuitive LiveScore app’s sports-specific dashboard allows virtually anyone to operate in-game live stream graphics. There’s no need for technical knowledge or experience in operating broadcast-level software. The operator only needs to be familiar with the sport and the ins and outs of the game. Even for the smallest productions, by streamlining the process of updating in-game events such as score and time, you can ensure that you have a professional, broadcast quality scorebug graphic, reduce operational costs and enhance the viewing experience for your fans.


Rich In-Game Stats - The Scorebug Extension

On a basic level, the scorebug is just a clock and a score, but it’s also a springboard for other in-game stats, key information and even match day advertising revenue. As we touched on above, the LiveScore app logs all in-game events. The Scorebug Extension graphic allows LIGR users to add eye-catching pop-out animations to the Scorebug Graphic that provide a richer viewing experience. These include stats like the name and time of a scorer, the number of fouls, corners or shots on target, or as in the example below, the number of offsides for a particular team.

The scorebug Extension Graphic showing the number of offsides, powered by LIGR.The scorebug Extension Graphic showing the number of offsides, powered by LIGR.

This powerful graphic gives broadcasters a simple way to drop interesting stats into the game. As the Scorebug Graphic is always visible during a game, briefly displaying stats in place of it, or alongside it, doesn’t interrupt the viewing experience or interfere with the game. LIGR users can choose to hide the time of the game to do this (as in the example above). The Scorebug Extension Graphic should only cover the time for a maximum of 10 seconds. It’s a handy function to use during a lull in play that helps to keep viewers engaged.
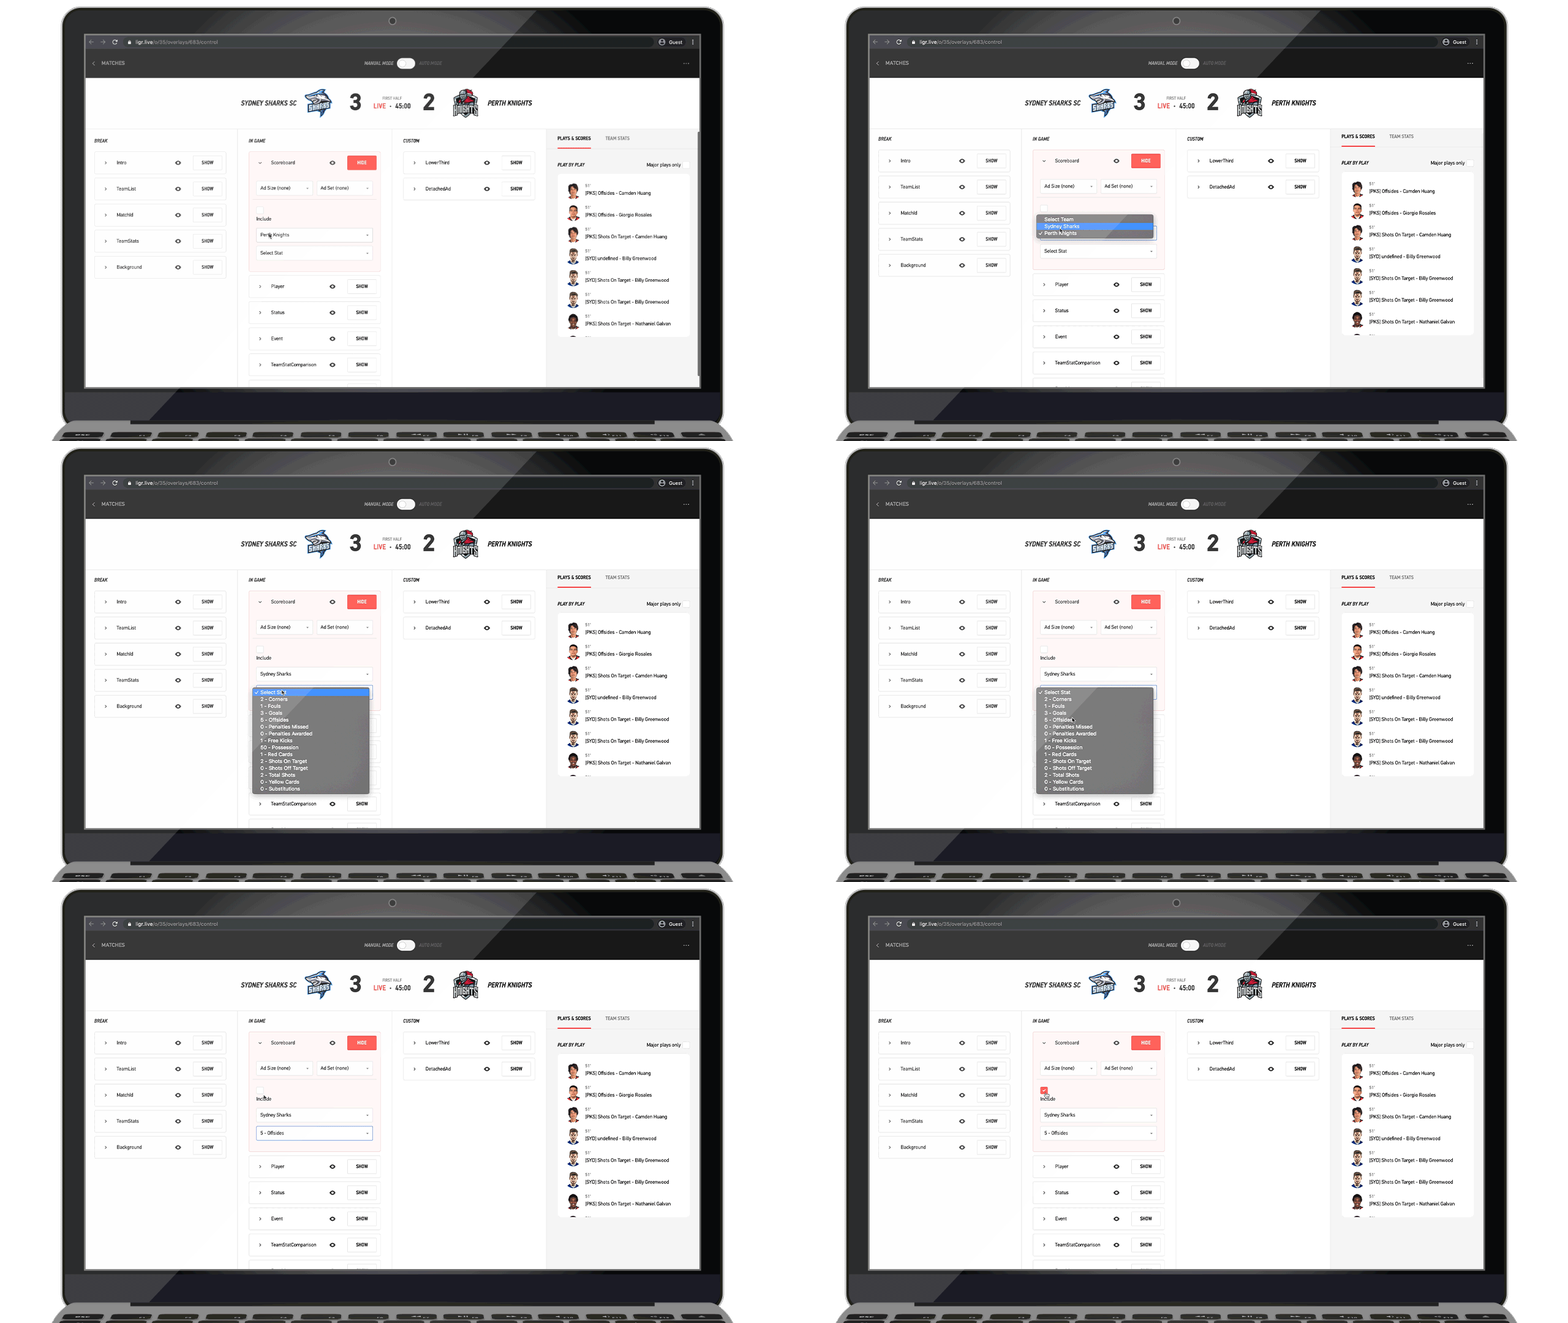
The Scorebug Extension controls in the LIGR control room.The Scorebug Extension controls in the LIGR control room.

In the LIGR.Live platform, after selecting which team you want to display a stat for (“CC Mariners FC” in the example above) and the specific stat you want to display (“Offsides”) users can toggle the Scorebug Extension on and off by selecting the “include” check box (as shown above). There’s a running total of each stat in the dropdown list to help you choose. It’s also possible to automate this process using AUTO mode; this allows pre-programmed stats to be shown at milestones during the game, such as every three offsides for each team.


Generating Revenue – The Scorebug and Sponsors

The Scorebug Graphic can also be used to display different sponsors throughout the game. Again, as the scorebug is a permanent fixture during the game, it can be leveraged to show sponsorship banners of varying sizes (see the two images below showing different McDonald’s branded banners). This functionality is built-in to all the graphics themes on the LIGR.Live platform. As with in-game stats, you can manually select and show these graphics or use AUTO mode to configure how you want to show sponsors at different times during the game.

The Scorebug Graphic with sponsorship, powered by LIGR.The Scorebug Graphic with sponsorship, powered by LIGR.

Displaying your sponsor’s banners is a nice feature, but the LIGR.Live platform is also a powerful advertising tracking and reporting system. We track every single ad exposure and compile performance reports into an easy to use dashboard. Users can output reports for their sponsors and breakdown ad displays from a single game, a round of fixtures, a season or across seasons, and collate performance across multiple sports and competitions.

The Scorebug Extension Graphic with sponsorship, powered by LIGR.The Scorebug Extension Graphic with sponsorship, powered by LIGR.


Summary:
Name: Scorebug Graphic
Primary Use: Display the teams, score and game time
Data Required: Team Short Names, Match Score, Live Clock
Sport Assets Required: Team Colors
Compatible Sponsor Assets: Small and Medium size, multiple adsets
When is the Graphic Deployed: During the game
Graphic Rating: 10/10

Next up in our Live Graphic’s series: The Team List. This graphic can take a huge amount of time and effort to put into place, but with LIGR, it’s simple.

Start of Graphics Series Next Blog: The Team List


Twitter Facebook LinkedIn

Team LIGR

Content Team

Ready to take your live streams to the next level?